
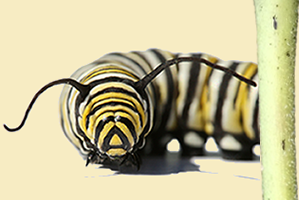
Site-Specific Surveys of Monarch Eggs, Larvae, and Milkweed Species
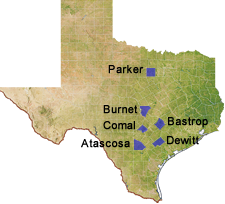
Six site-specific surveys were conducted in Atascosa, Bastrop, Burnet, Comal, Dewitt, and Parker counties during spring of 2016, 2017, and 2018 and fall of 2016 and 2017. For each property, a web soil survey was conducted to determine the soil type.
For each soil type located on the property, two 750 m2 areas were sampled in each soil type and the following was measured:
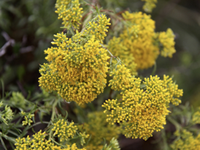
- Number and species of milkweeds
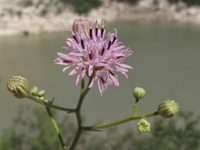
- Percent cover of other species
- Number of flower blooms
- Distance to the nearest fire ant mound
- Cover of soil, rock, and litter
- Number of monarch eggs and larvae
County |
Ecoregion |
Land Use |
|---|---|---|
Atascosa |
South Texas Plains |
hay / pasture / herbaceous |
Bastrop |
Post Oak Savanna |
hay / pasture |
Burnet |
Cross Timbers |
herbaceous |
Comal |
Edwards Plateau |
mixed forest |
Dewitt |
Post Oak Savanna / |
hay / pasture |
Parker |
Cross Timbers |
herbaceous |
Spring 2016
County |
Milkweed Species Richness |
Mean Plant Density |
Mean Stem Density |
Mean Plant Density |
Mean Stem Density |
|---|---|---|---|---|---|
Atascosa |
0 |
0 |
0 |
0 |
0 |
Bastrop |
2 |
0.28 |
2767 |
0.52 |
5200 |
Burnet |
2 |
0.19 |
1900 |
0.67 |
6700 |
Comal |
1 |
0 |
22 |
0 |
39 |
Dewitt |
3 |
0.23 |
2283 |
0.93 |
9283 |
Parker |
3 |
0.59 |
5917 |
1.15 |
11,450 |
Fall 2016
County |
Milkweed Species Richness |
Mean Plant Density |
Mean Stem Density |
Mean Plant Density |
Mean Stem Density |
|---|---|---|---|---|---|
Atascosa |
0 |
0 |
0 |
0 |
0 |
Bastrop |
1 |
0 |
8 |
0 |
10 |
Burnet |
1 |
0 |
13 |
0 |
17 |
Comal |
1 |
0 |
3 |
0 |
3 |
Dewitt |
1 |
0 |
3 |
0 |
3 |
Parker |
2 |
0.01 |
50 |
0.01 |
67 |
Spring 2017
County |
Milkweed Species Richness |
Mean Plant Density |
Mean Stem Density |
Mean Plant Density |
Mean Stem Density |
|---|---|---|---|---|---|
Atascosa |
0 |
0 |
0 |
0 |
0 |
Bastrop |
2 |
0.02 |
232 |
0.04 |
386 |
Burnet |
1 |
0.04 |
410 |
0.11 |
1138 |
Comal |
1 |
0.01 |
147 |
0.05 |
506 |
Dewitt |
2 |
0.01 |
121 |
0.04 |
379 |
Parker |
3 |
0.03 |
332 |
0.07 |
650 |
Fall 2017
County |
Milkweed Species Richness |
Mean Plant Density |
Mean Stem Density |
Mean Plant Density |
Mean Stem Density |
|---|---|---|---|---|---|
Atascosa |
0 |
0 |
0 |
0 |
0 |
Bastrop |
3 |
0.01 |
110 |
0.01 |
111 |
Burnet |
1 |
0 |
13 |
0 |
27 |
Comal |
1 |
0.02 |
249 |
0.05 |
476 |
Dewitt |
1 |
0.03 |
33 |
0.01 |
63 |
Parker |
1 |
0.01 |
3 |
0.01 |
3 |
Spring 2018
County |
Milkweed Species Richness |
Mean Plant Density |
Mean Stem Density |
Mean Plant Density |
Mean Stem Density |
|---|---|---|---|---|---|
Atascosa |
0 |
0 |
0 |
0 |
0 |
Bastrop |
3 |
0.03 |
303 |
0.06 |
644 |
Burnet |
1 |
0.07 |
740 |
0.27 |
2683 |
Comal |
1 |
0.02 |
227 |
0.08 |
756 |
Dewitt |
2 |
0.03 |
349 |
0.13 |
1307 |
Parker |
4 |
0.04 |
429 |
0.09 |
871 |