E2 Total Fall Enrollment (45,000 in Fall 2028)
| Fa. 2014 | Fa. 2015 | Fa. 2016 | Fa. 2017 | Fa. 2018 | ||||||
|---|---|---|---|---|---|---|---|---|---|---|
| # | % | # | % | # | % | # | % | # | % | |
| Undergraduate | 24,285 | 84.8% | 24,462 | 85.0% | 24,423 | 84.3% | 26,011 | 84.8% | 27,443 | 85.5% |
| Post-Bac | 297 | 1.0% | 259 | 0.9% | 403 | 1.4% | 443 | 1.4% | 496 | 1.5% |
| Masters | 3,264 | 11.4% | 3,325 | 11.6% | 3,392 | 11.7% | 3,419 | 11.1% | 3,340 | 10.4% |
| Doctoral | 782 | 2.7% | 741 | 2.6% | 741 | 2.6% | 801 | 2.6% | 822 | 2.6% |
| Total | 28,628 | 100.0% | 28,787 | 100.0% | 28,959 | 100.0% | 30,674 | 100.0% | 32,101 | 100.0% |
E2 Total Fall Enrollment
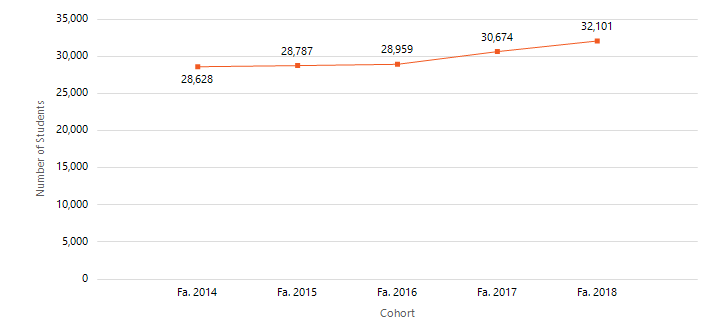
Fall Enrollment by Student Level
The number of students enrolled at UTSA as of Census Day in the Fall semester. Student level is determined by students’ classification in the Texas Higher Education Coordinating Board Enrollment Report (CBM001).
Source: Texas Higher Education Coordinating Board Enrollment Report (CBM001).